Troubleshooting Guide
When encountering issues with MQTTX, providing detailed information can significantly speed up the resolution process. This guide outlines the essential information to collect for most troubleshooting scenarios, especially for UI-related problems, debugging MQTT packets, or when Developer Tools access is needed.
Information to Collect
1. Screenshot of the Issue A clear screenshot depicting the problem. Please ensure any sensitive information is redacted.
2. Steps to Reproduce Provide a detailed, step-by-step account of how to reproduce the issue consistently. The more specific you are, the easier it will be to diagnose.
3. System and MQTTX Information Collect this information to help understand the environment:
- MQTTX Version: Click the "i" button (About) at the bottom left of the MQTTX interface to find the version information.
- Operating System: Specify your OS and version (e.g., Windows 10 Pro, macOS Sonoma 14.2, Ubuntu 22.04 LTS).
4. Network Environment Describe your network setup:
- Are you using a VPN, corporate proxy, Zscaler, or any other local firewall software?
- Are there any specific network configurations that might interfere with MQTTX's connectivity or rendering?
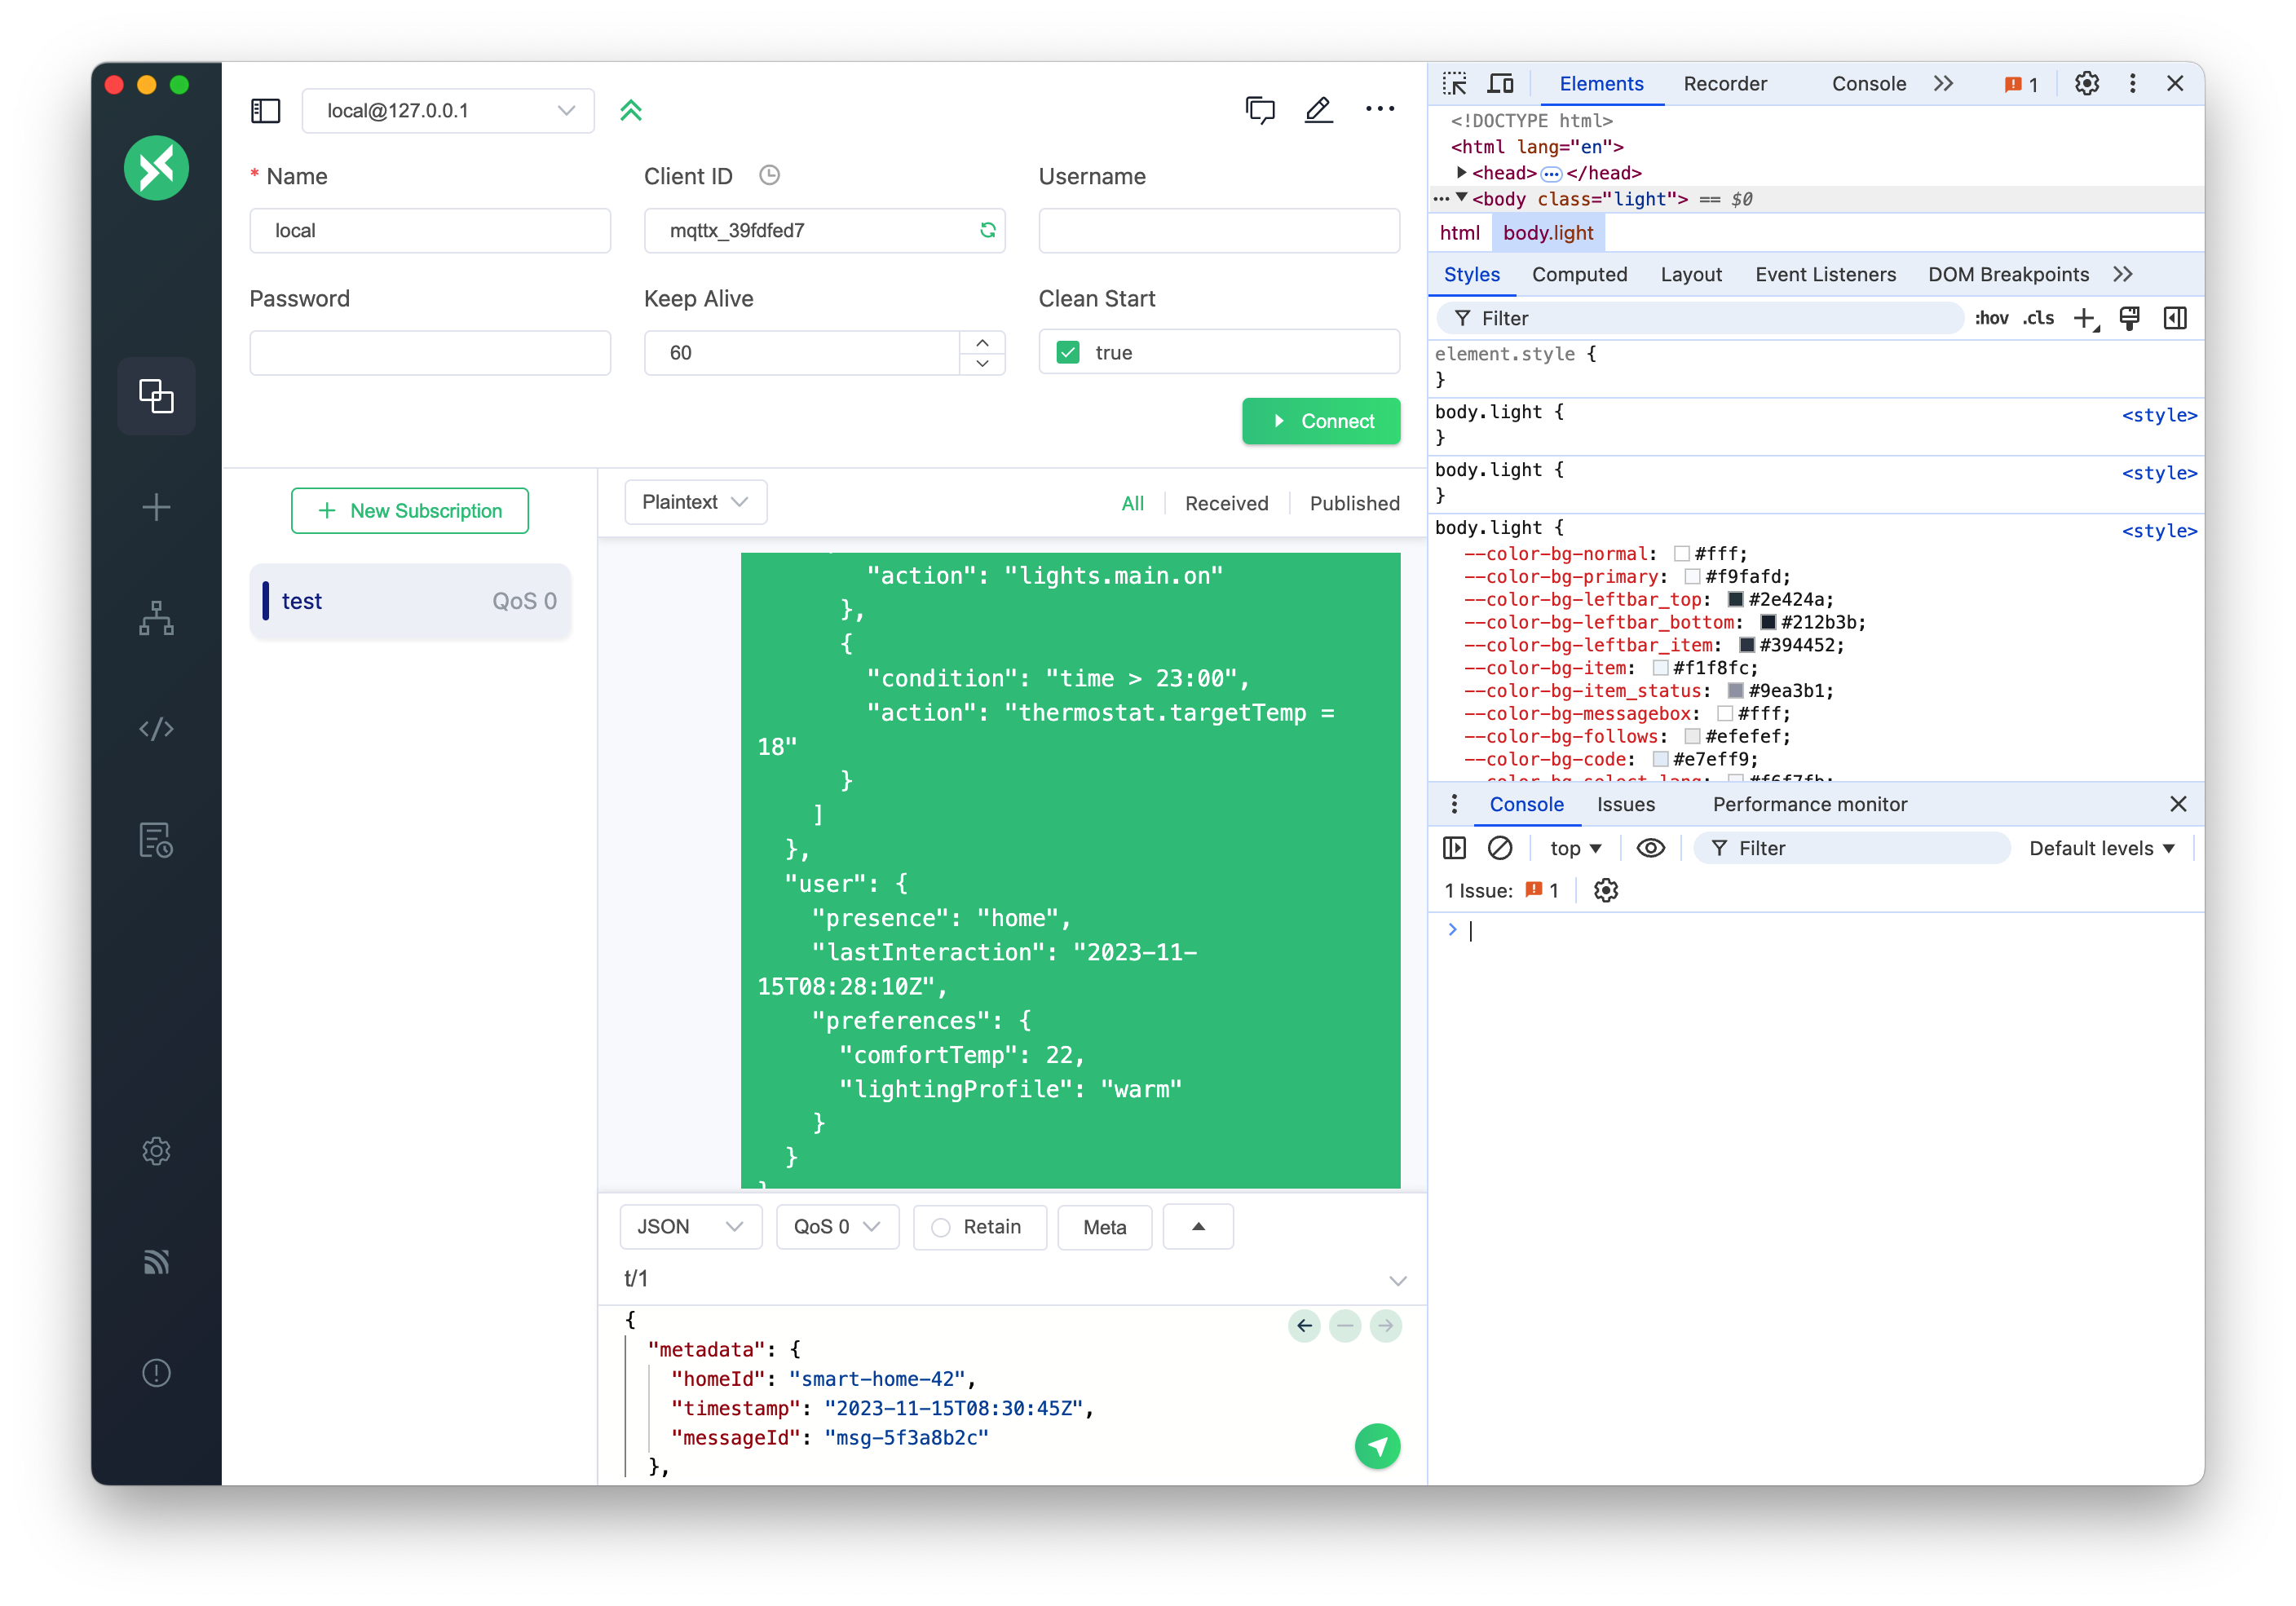
5. Developer Tools Console Errors For UI-related issues, white screens, rendering errors, or unexpected behavior in the interface, the Developer Tools console is invaluable.
- How to Open Developer Tools:
- Using Keyboard Shortcuts:
- Windows/Linux:
Ctrl + Shift + I - macOS:
Cmd + Opt + I
- Windows/Linux:
- Using Menu:
- Click on the top menu
View->Toggle Developer Tools
- Click on the top menu
- Using Keyboard Shortcuts:
- Using the Console:
- Once Developer Tools are open, click on the
Consoletab. - Look for any error messages (usually highlighted in red) or warnings that appear when you reproduce the issue.
- Copy and paste the relevant error messages in full.
- Once Developer Tools are open, click on the
- Important Note on Developer Tools:
- Developer Tools are not loaded by default in MQTTX to optimize performance and maintain a smaller application bundle size.
- They are designed to load only when explicitly invoked using the shortcuts or menu. This allows for on-site debugging in production environments, which is crucial when encountering visual glitches or functional impairments in the UI, enabling inspection of network traffic, console logs, and performance profiling.

6. MQTTX Logs MQTTX generates logs that can provide insights into its operations and any errors encountered.
- Log Levels: The log system displays information at four levels:
DEBUG: Detailed debugging information, including MQTT.js packet details, to assist in troubleshooting.INFO: Feedback on user operational information.WARN: Warnings about unsafe actions or potential risks.ERROR: Error messages when a failure occurs.
- Log File Locations:
OS Log File Path Linux ~/.config/MQTTX/logs/logmacOS ~/Library/Application Support/MQTTX/logs/logWindows %USERPROFILE%\AppData\Roaming\MQTTX\logs\log - Log Rotation: Each time MQTTX is closed, the current log file is renamed with a timestamp (e.g.,
[YY]-[MM]-[DD]T[hh]:[mm].log), and a newlogfile is created on the next launch. Please provide the relevant log file(s).
Addressing White Screens or Rendering Errors
Through keyboard shortcuts (Ctrl + Shift + I / Cmd + Opt + I) or menu options (View -> Toggle Developer Tools), you can access Developer Tools to diagnose issues like white screens or unexpected rendering behavior in production environments. Since DevTools are disabled by default for performance reasons, these access methods provide essential mechanisms for users and contributors to directly obtain debugging information when these problems occur, facilitating faster root-cause analysis.
(A future improvement could involve capturing console.error messages automatically and providing an option to upload them, which would reduce the need for manual log collection.)
By providing this information, you can help the development team and community understand and resolve your issue more effectively.